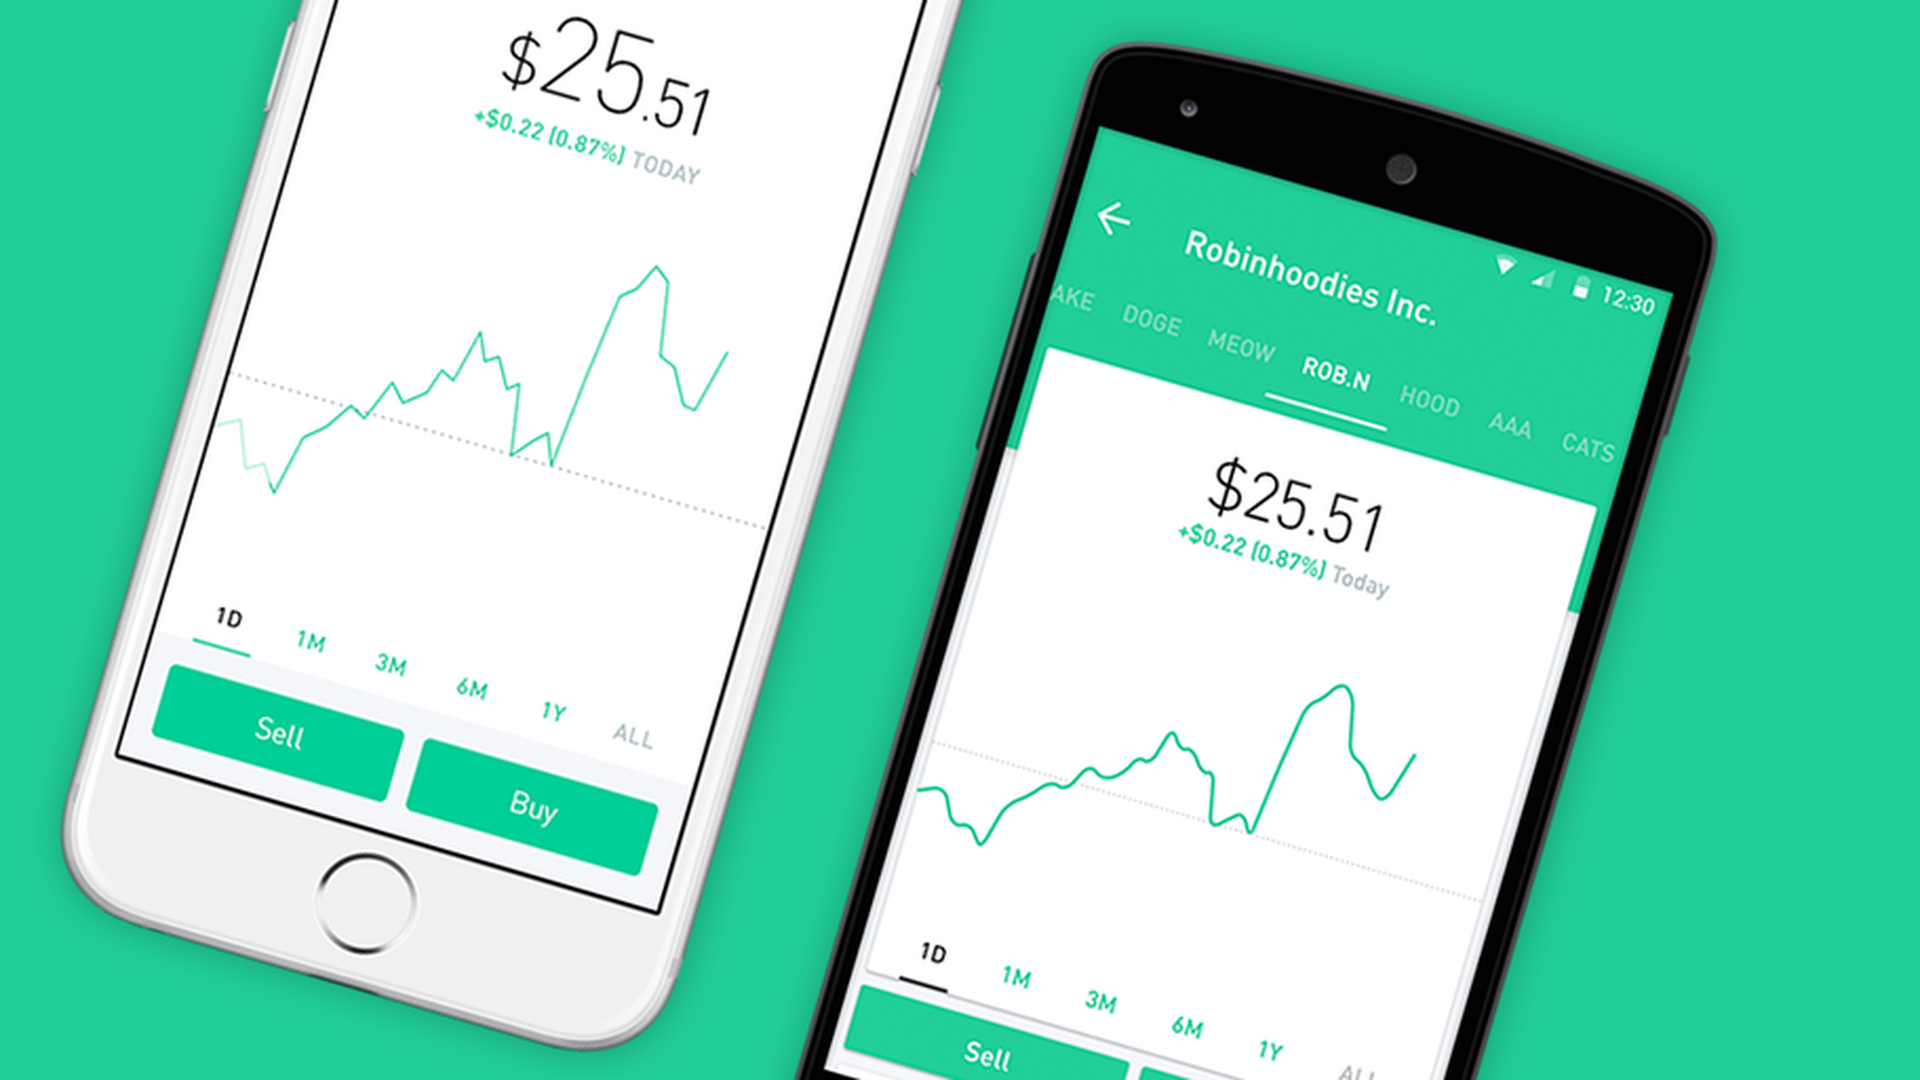
Robinhood's app displays info on each stock that you can use to make informed decisions on potential investments, track your returns, and more. We'll go over the information provided and how to utilize it.
Note: cryptocurrency details vary from the traditional stock details. For crypto details, check out How to Read the Robinhood Cryptocurrency Details.
Sections
Dotted line/Price Movement
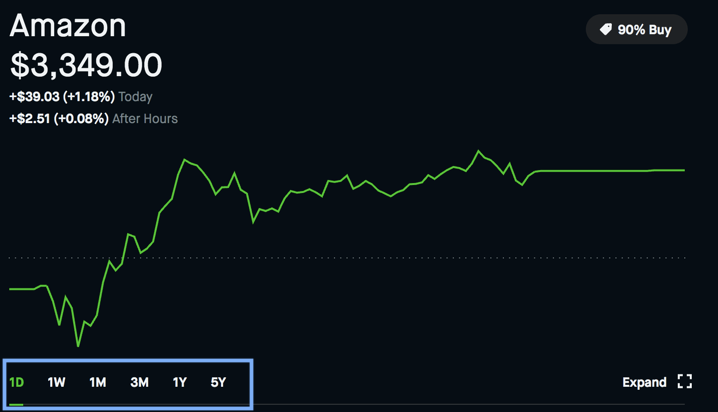
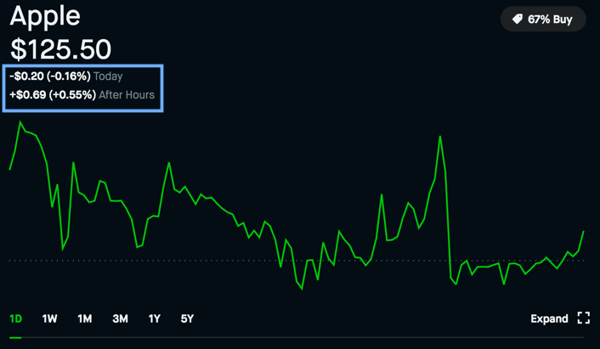
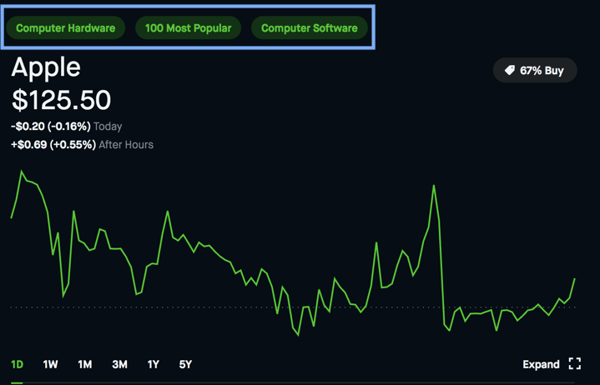
When looking at the stock graph with the 1-day range selected, a dotted line will appear across the graph. This line represents the previous day's closing price.
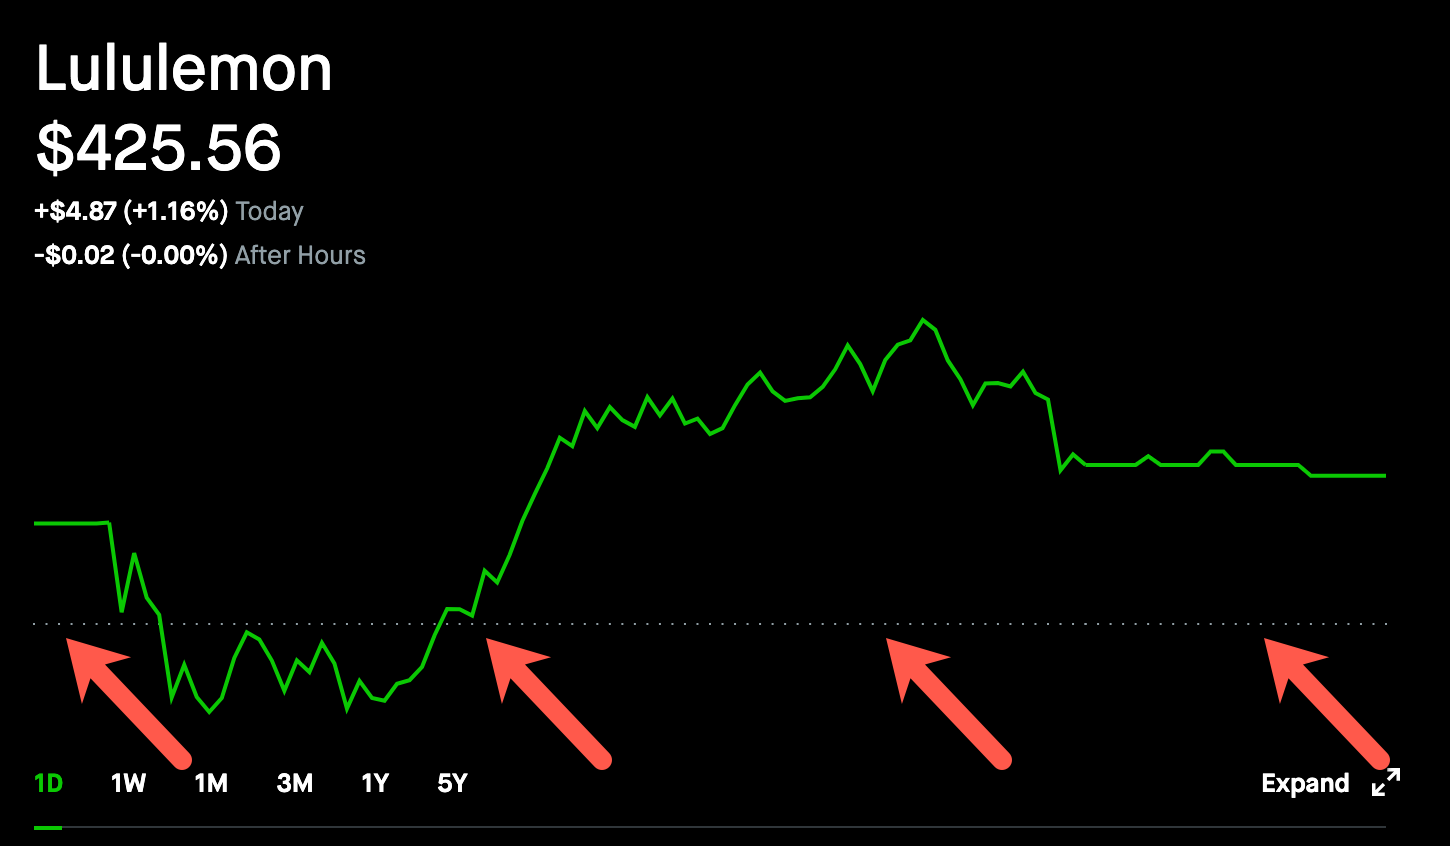
The current day's price may fluctuate above or below the dotted line. As it does, the graph's color will change to green (above the line) or red (below the line) to help visualize the current price movement.
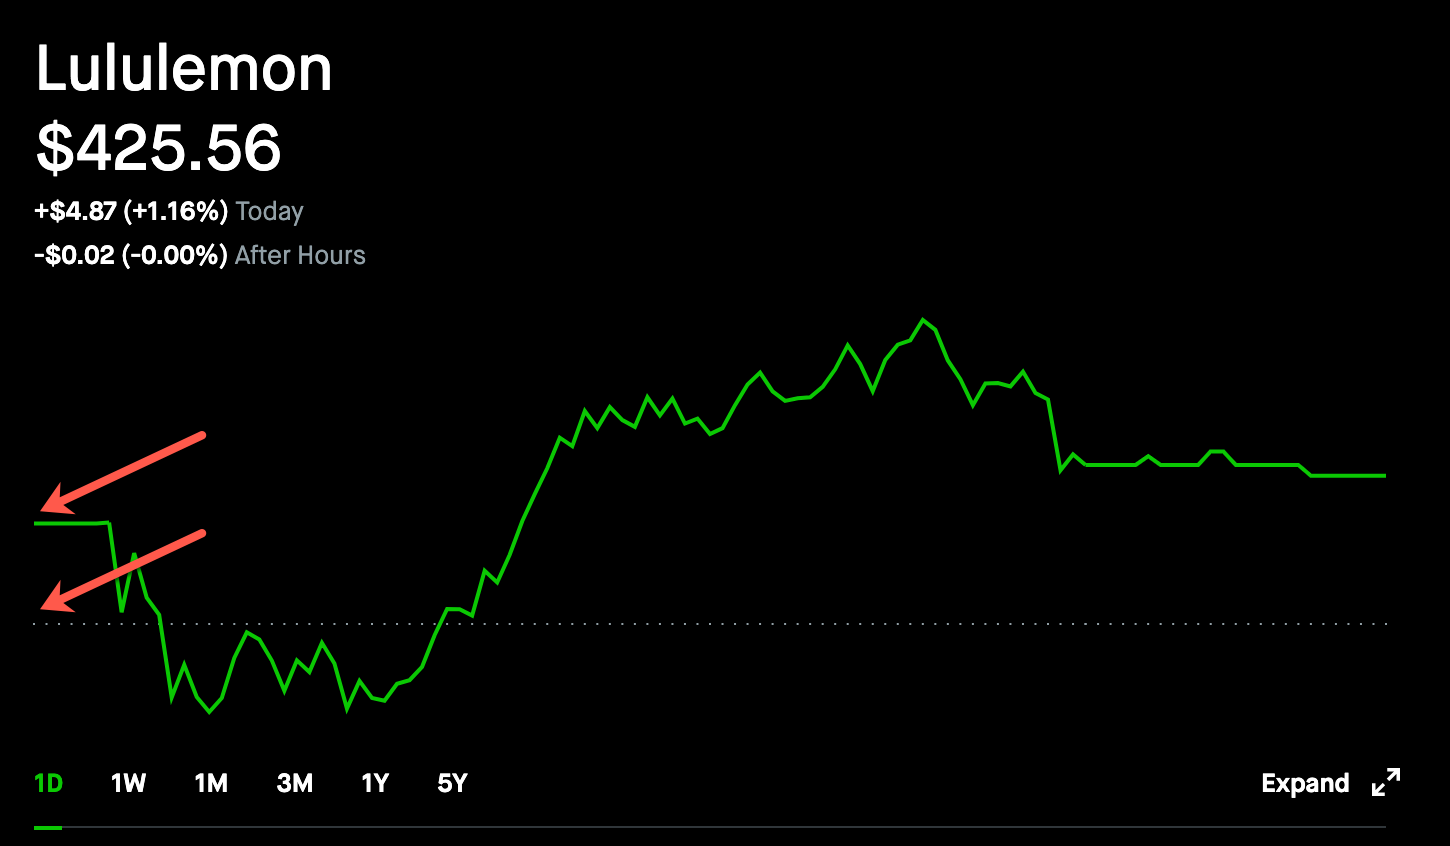
The current day can start above or below the previous day's close. This is because of changes to the stock price during previous day after-hours or current day pre-market trading.
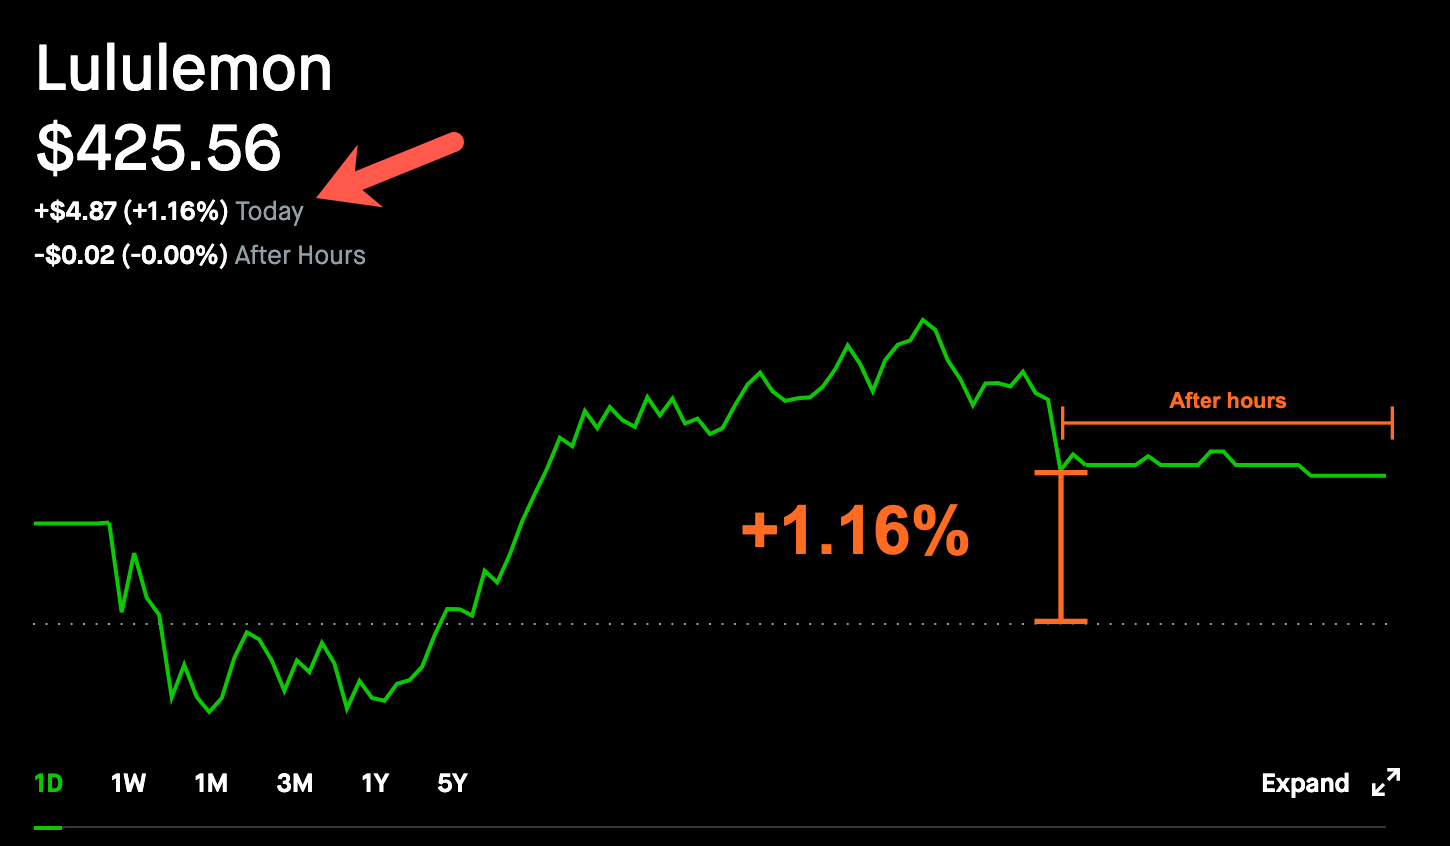
The price change for the day is calculated by looking at the difference between the previous day's close and the current day's close. After-hours trading does not count.
Changing the timespan
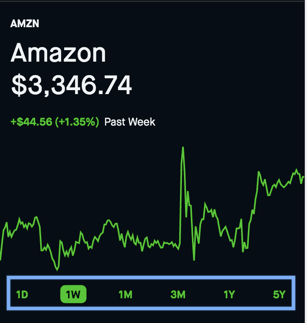
The chart tracks the stock's value over time. You can change the view to display a one day, one week, one month, three months, one year, or five-year range.
Mobile
The buttons are centered and just below the price graph. They are green or red depending on the price movement.
Web
The buttons are left-aligned and below the price graph. They are shown as white text but the selected range is colored green or red depending on the price movement.
Viewing the price at a specific time
Mobile
Tap and hold on to the graph itself to see specific price points along the timeline. Dragging left and right will display the stock price at a specific time.
Web
Hover over the graph to see specific price points along the timeline.
Viewing extended-hours session
During the extended-hours session, there are two lines showing value changes. One shows the stock value during the regular trading session and the other shows the ongoing value change after the regular trading hours. Regular trading hours for the U.S. stock market, including the New York Stock Exchange (NYSE) and the Nasdaq Stock Market (Nasdaq), are 9:30 a.m. to 4 p.m. Eastern time on weekdays (except stock market holidays).
If you have an open position in a stock, you can see information about your returns, your equity, and your portfolio diversity.
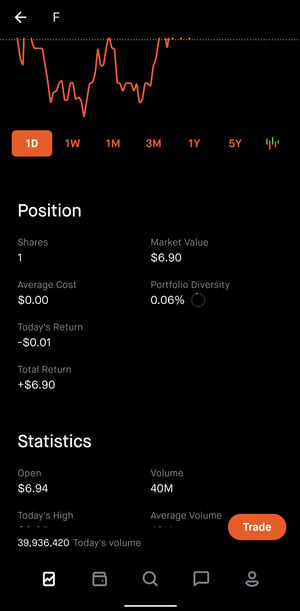
Shares: The number of shares you own
Market Value: The value of your shares
Average Cost: The average amount you paid for your shares
Portfolio Diversity: The percentage of your portfolio invested in the asset
Today's Return: The amount of money you’ve made or lost on the stock on that trading day
Total Return: The amount of money you’ve made or lost since you first acquired a share of the stock
Collections allow you to see which curated groups a stock falls into so that you can quickly find more stocks like it. There's no page that shows you all the collections Robinhood has. They appear as suggestions as you navigate and search.
You can see the popular collections here.
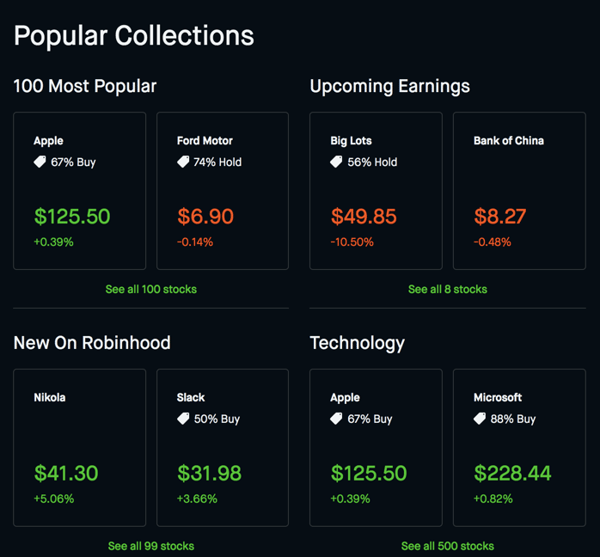
This feature is only available for stocks, not cryptocurrencies or options. Robinhood omits stocks under $300M market capitalization from the "Upcoming Earnings", "Top Movers", and "Top 100 Most Popular" collections.
Statistics provide more information about a stock you may want to buy or sell.
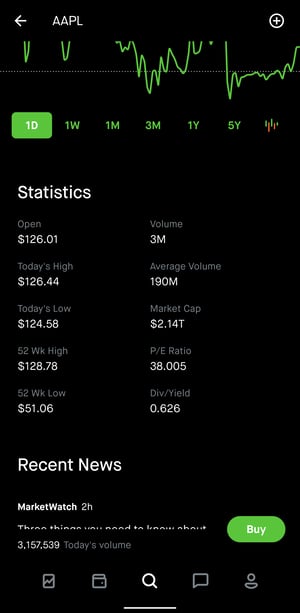
Open: The value of the stock at market open
Today's High: The stock’s highest value during the day’s trading session
Today's Low: The stock’s lowest value during the day’s trading session
52-Week High: The stock’s highest value in the last 52 weeks
52-Week Low: The stock’s lowest value in the last 52 weeks
Volume: The number of shares traded on Nasdaq during the day’s trading session
Average Volume: The average number of shares traded per day over the last 52 weeks, on all exchanges
P/E (Price Earnings) Ratio: The stock’s price-per-share to earnings-per-share ratio
Dividend/Yield: The stock’s fiscal dividend yield
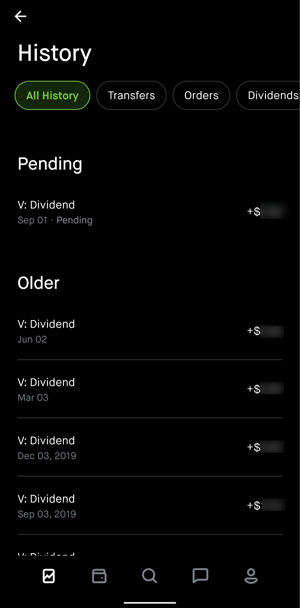
You can view your buy and sell history for a stock you own.
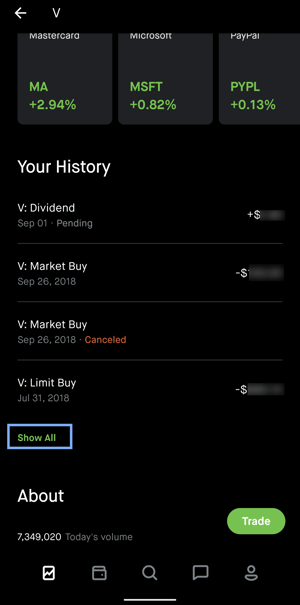
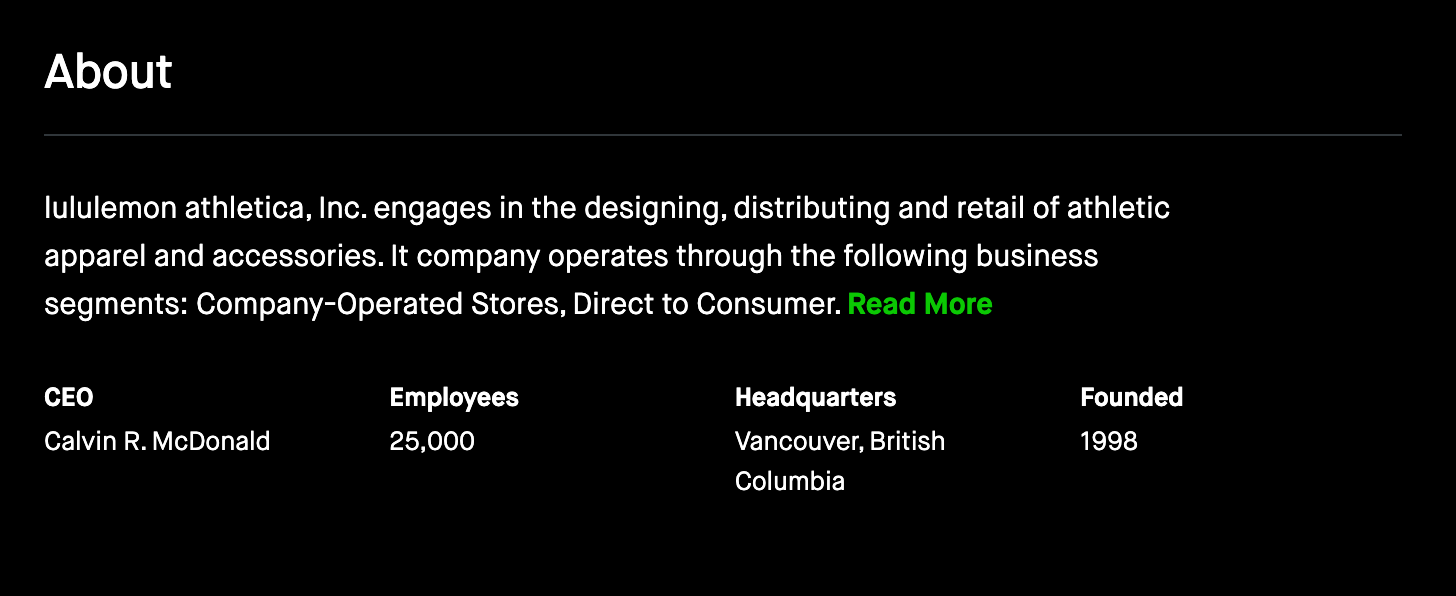
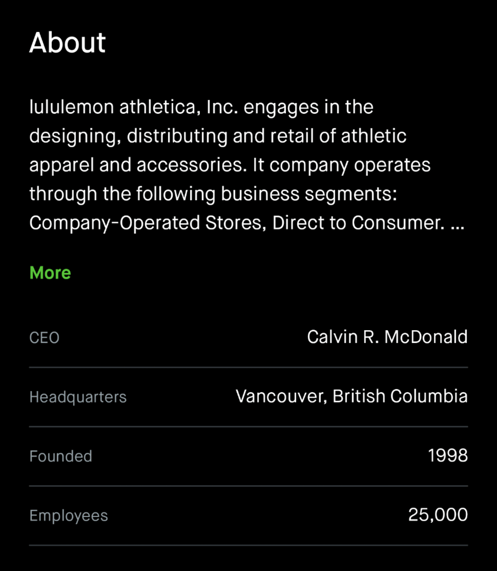
You can check out a brief description of the company or fund in this section. Both mobile and web display the same information.
Mobile
Web